Update Date: June - 2024
Carlos Alegria, Yuri Nunes
Go to paper pre-print (Research Gate) Paper Link
Navigation to related reports:
US - Death Trends from Neoplasms, Ages 15-44
US - Death Trends from Neoplasms for all ages and detailed analysis of 75-84
US - Estimating Covid-19 over-reporting as underlying cause of death.
In this section we perform an analysis of the trend in yearly death rates for individuals aged 15 to 44 in the US, using the data from CDC WONDER. In this analysis we use the 2010-2019 trend in deaths per 100,000 (death rates) as the baseline estimate for excess death rates. Excess death rates for the 2010-2019 period are in-sample while the rates for 2020, 2021, 2022 and 2023 are out of sample computations.
In our study we investigate trends in MC (multiple-cause) and UC (underlying cause) deaths rates from neurological diseases, and also, trends in MC* death rates (MC deaths where COVID-19-related death are removed).
To contextualise trends in death rates from neurological diseases, we first analyse the trends in all-cause death rates.
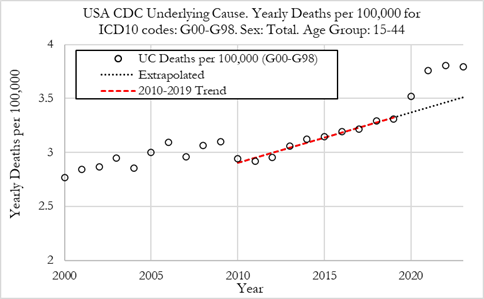
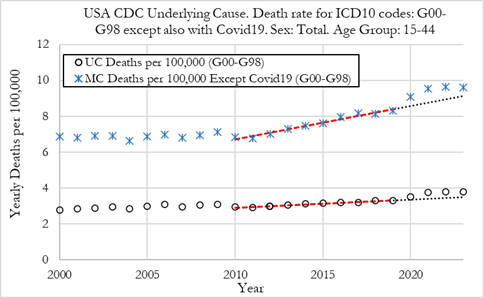
Figure 3 (left) shows the death rate per 100,000 individuals for deaths from neurological diseases (ICD10 codes: G00-G98) in the US from 2010 to 2023. We can observe that deaths per year from neurological diseases in the 15-44 age group have been trending higher from 2010 to 2019. In 2010 the death rate was 2.94 per 100,000 and in 2019 it was 3.31 per 100,000, a 12.6% rise.
Summary:
The death rate rose in 2020 to 3.52 per 100,000, and then rose again to 3.76 per 100,000 in 2021. In 2022 the death rate rose further to 3.81 per 100,000 and in 2023 it was 3.80 per 100,000.
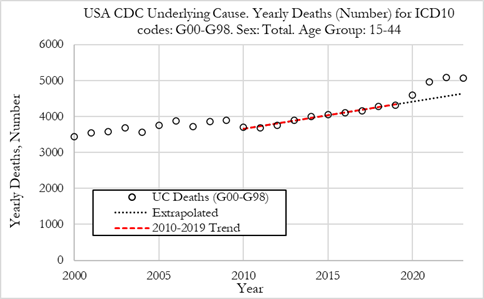
When presenting these numbers as the absolute number of deaths for diseases from neurological diseases, shown in the Figure (right), we can observe that in 2020 there were 4602 deaths, while in 2021 there were 4963 deaths, 5085 in 2022, and 5070 in 2023.
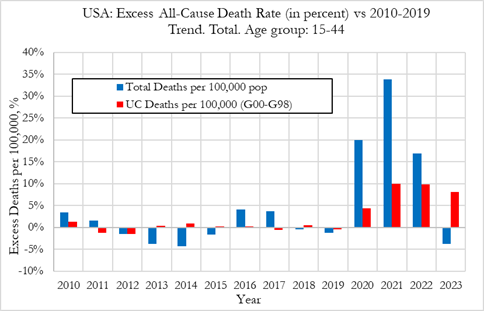
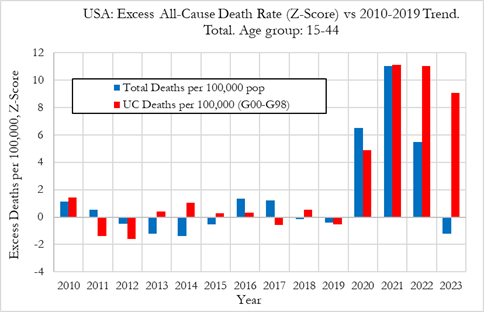
The Figure below shows the excess death rate from neurological diseases as underlying cause in the US, for the 15 to 44 age group from 2010 to 2023. The plots also show the excess all-cause deaths for comparison. The figure on the left refers to relative deviations from the 2010-2019 trend, while Figure on the right shows the Z-score (signal strength) for the deviations from trend.
Summary:
In this section we investigate the trends in death rates from 2010 to 2023 where neurological diseases (ICD-10 codes G00 to G98) were reported in one of the multiple causes of death (either underlying or secondary cause of death), for the 15-44 age group of both sexes.
MC deaths rates need to be analysed with a degree of caution as they refer to death rates for a given disease where it is either the underlying cause or a contributing factor towards death. Neurological diseases tend to be contributing causes of death instead of underlying cause which means that MC death rates from neurological diseases could amount to several times the UC death rate.
Nonetheless, by analysing both MC death rates and UC death rates, we can have a better understanding of the underlying phenomena that lead to neurological-related deaths.
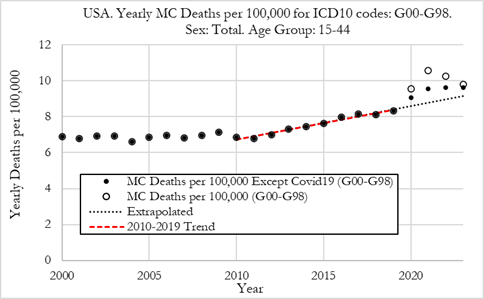
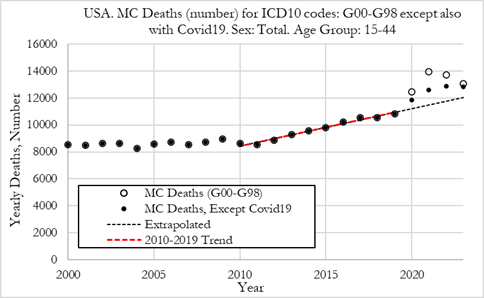
The Figure (left) shows the death rate per 100,000 individuals for deaths from neurological disease in the US from 2010 to 2023, where neurological diseases appear as one of multiple causes of death (either underlying or contributing). The figure also shows the MC* death rates from neurological diseases, which is death rates with neurological diseases as a multiple cause, except where COVID-19 is also reported as the underlying or a contributing cause.
We can observe that MC deaths per year from neurological diseases have been trending upwards from 2010 to 2019. In 2010 the death rate was 6.85 per 100,000 and in 2019 it was 8.32 per 100,000, a 21.5% rise.
Summary:
MC death rates from neurological diseases rose substantially in 2020 to 9.54 per 100,000 and then rose to 10.57 per 100,000 in 2021 and then dropped slightly to 10.26 per 100,000 in 2022 and to 9.78 per 100,000 in 2023.
When deaths where COVID-19 was also reported as a cause of death were removed, we observe that the MC* death rates (per 100,000) from neurological diseases were 9.07 in 2020, 9.53 in 2021 and 9.63 in 2022 and 9.61 in 2023. Even after removing COVID-19 related deaths, we observe an increase in MC* neurological deaths in 2020, 2021 and 2022, and a stabilisation in 2023 rather than a reversion to trend.
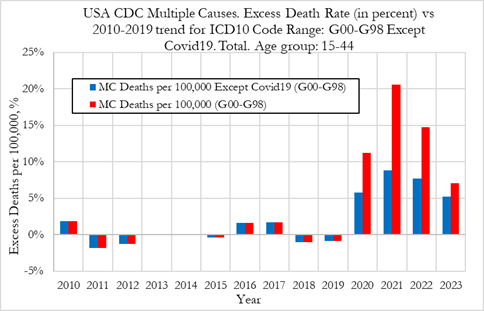
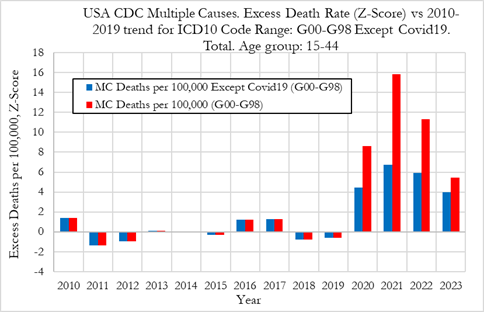
The Figure below compares the excess MC death rates from neurological diseases from 2010 to 2023, while also showing, for comparison, the excess from MC deaths from neurological diseases where COVID-19-related deaths were not counted, for ages 15 to 44 in the US. The figure on the left refers to relative deviations from the 2010-2019 trend, while Figure 6 (right) shows the Z-score (signal strength) for the deviations from trend.
It should be noted that the way excess death rates (either MC death rates or UC cause death rates) are computed, they adjust for prior trends in deaths rates and are also scale-adjusted when relative deviation from trends are computed. We also compute volatility-adjusted (dispersion around the trend) excess death rates which allows us to have an idea of the signal strengths, and which also allows for a direct comparison of excess MC death rates with excess UC death rates.
Summary:
We now compare the trends in MC* death rates and UC death rates from neurological diseases (ICD-10 codes G00 to G98), from 2010 to 2023 for the 15-44 age group of both sexes.
Figure (left) below shows the MC* deaths rates and UC death rates from neurological diseases for ages 15 to 44 in the US, from 2010 to 2023. When comparing UC and MC* death rates, we observe that both have been trending higher from 2010 to 2019.
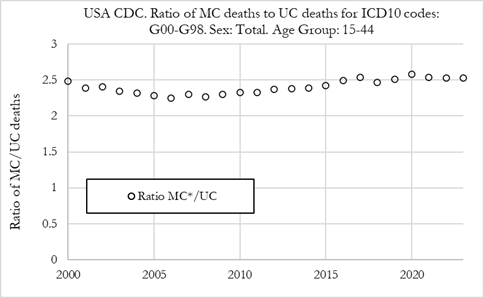
We also observe that MC* death rates are substantially higher than UC death rates from neurological diseases, as illustrated by the ratio of MC*/UC death rates (Figure - right) which is close to 2.5 across the 2010-2023 period. The ratio did not vary significantly during the pandemic years, 2020, 2021, 2022 and 2023, indicating that both MC* and UC death rates from neurological diseases had similar trends during those years.
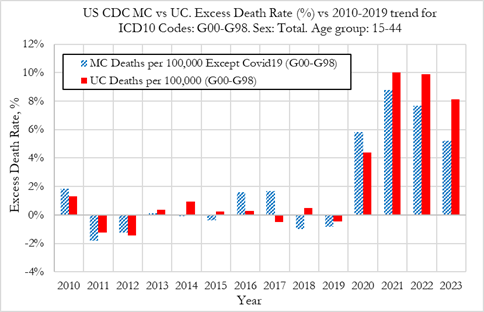
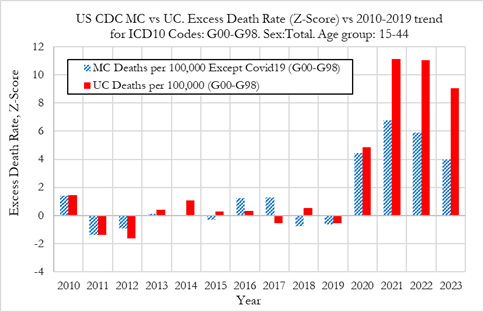
This is confirmed in the Figure below that illustrates the excess MC* and UC deaths rates from neurological diseases, which overall show similar pattern of excess death rates in 2020, 2021, 2022 and 2023. In 2020, the excess UC death rate from neurological diseases was 4.4%, while 5.8% for MC* death rate, both having high Z-scores of 4.9 and 4.5, respectively (as shown in the Figure below - right).
In 2021, the excess UC death rate was 10.0% with a Z-Score of 11.1, while for MC*, the excess death rate was 8.8% with a Z-score of 6.7. In 2022, the UC excess death rate was 9.9%, while 7.7% for MC*, with respective Z-Scores of 11.0 and 5.9. In 2023, the UC excess death rate was 8.1%, while 5.2% for MC*, with respective Z-Scores of 9.0 and 4.0.
Interestingly, for comparison, the excess UC death rates from neoplasms for individuals aged 15 to 44 in the US were 1.7% in 2020, 5.6% in 2021, and 7.9% in 2022, with Z-Scores of 3.5, 11.8 and 16.5, respectively, as reported in our previous paper showing an equivalent analysis for neoplasm deaths (Alegria, Wiseman, & Nunes, US -Death Trends for Neoplasms ICD codes: C00-D48, Ages 15-44, 2024).
We conclude that UC neurological disease deaths show a similar pattern of excess death rates as previously reported for neoplasms, with the main difference being that neurological death rates showed larger rises in 2020, a rise that already represented a signal with high statistical significance.
Possible explanations for the change from the historical trend in neurological deaths in 2020, include the collateral effects of the lockdowns on the lifestyle habits of individuals aged 15 to 44, such as alcohol consumption, fentanyl, or other drugs. Other explanations could include COVID-19 side effects that were not recognised or recorded on the death certificates. From 2021 onwards, lockdowns likely played a smaller role in the continued rising excess death rates from neurological diseases, while a new factor was introduced in the form of the novel COVID-19 vaccinations which could have played a significant role, together with enduring effects from multiple SARS-CoV-2 exposures.
